Gauge
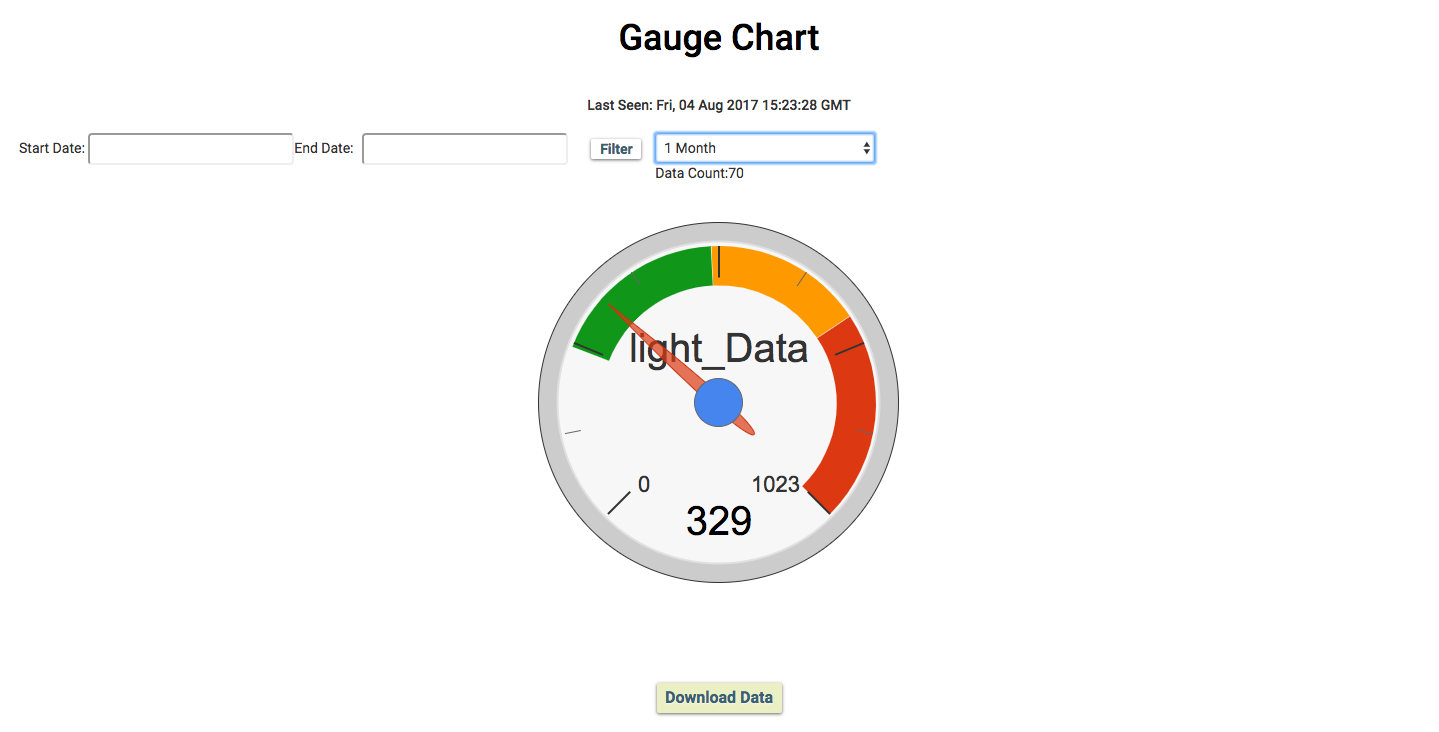
Gauge chart (also known as dial chart or speedometer chart) uses a single needle to show information as a reading on a dial. On the gauge chart, the value for the needle is read on a colored data range. This chart type is often used in executive dashboard reports to show key business indicators. It’s a great tool to help visualize percentages, as well as other fixed-range amounts for end users.
Note: Choose the file extension as js.
Sample Code
setChartLibrary('google-chart');
setChartTitle('Gauge Chart');
setChartType('gauge');
setAxisName('axis_name');
setDimensions(400,400);
setMaxValue(1023);
setYellow(501,725);
setRed(726,1023);
setGreen(250,500);
plotChart('your_variable_name');
Output

Code Format
| Syntax | Parameter(s) | Description |
|---|---|---|
| setChartLibrary('google-chart'); | Library Name | Set the chart library to be used. Bolt Cloud uses 'google-chart' to visualize the data. |
| setChartTitle('Your Graph Title'); | Graph Name | Set the title of the graph according to your choice. |
| setChartType('gauge'); | Graph type | Set the type of chart to be plotted. Bolt Cloud offers 8 different types of charts to be plotted i.e Line Graph, Bar Graph, Scatter Graph, Area Graph, Table Graph, Stepped Graph, Histogram Graph, and Gauge. |
| setAxisName('axis_name'); | Axis Name | In Gauge chart, there is no axis. You can use this function to put a label inside the gauge. If this function is not used then it will take the variable name from the plotChart function as the default value for the label. |
| plotChart('your_variable_name'); | Variable Name | Display the graph on the screen for the given variables.In Gauge, there is only one parameter i.e the variable name that you have given during hardware configuration of the product. If you will not pass the variable name then it will take the variable name from setAxisName function. |
| setLogo('logo_source', height, width); | Logo path & Dimensions | Set the logo of your choice to be displayed at the top left corner of the website. The first parameter is logo source and the second and third parameter is the height and width of the image in pixels. Every parameter is optional. Bolt's logo and height of 45 px are set by default. |
| setDimensions(width,height); | Dimension | This syntax helps to resize your gauge. Pass the height and width as the parameter. |
| setMaxValue(max_value); | Max Value | Set the max value for the gauge. |
| setRed(min,max); | Interval Range | Set the Red color between the given interval range. |
| setYellow(min,max); | Interval Range | Set the Yellow color between the given interval range. |
| setGreen(min,max); | Interval Range | Set the Green color between the given interval range. |
Updated about 2 years ago
