Multiple Graph
You can now plot multiple graphs via the product code. You can also plot multiple variables on each graph.
The multi-graph feature also supports the following chart types.
- lineGraph
- barGraph
- scatterGraph
- steppedGraph
- areaGraph
- tableGraph
Note: Choose the file extension as js.
Note: Example codes with images of how the output will look like have been given at the end of this page.
Code Format
| Syntax | Parameter(s) | Description |
|---|---|---|
| var graphObj = new boltGraph(); | None | Create a new graph object. You can give any name to object. |
| graphObj.setChartType( "Chart type"); |
Graph type | Set the type of chart to be plotted. The allowed chart types are "lineGraph", "barGraph", "scatterGraph", "steppedGraph", "areaGraph" and "tableGraph" |
| graphObj.setAxisName( 'X-Axis Name', 'Y-axis Name'); |
Axis Name | Set the display name for each of the graph axis of the graph object. |
| graphObj.plotChart('time_stamp', 'your_variable_name1', 'your_variable_name2', 'your_variable_name3'.....); |
Names of all variables that you want to plot. | Display the graph on the screen for the given graph object i.e. graphObj. Only the first parameter can be 'time_stamp'. The function takes as many parameters as you supply, as long as all of them are valid variable names configured in the hardware configuration of the product. |
| graphObj.scaleData(scale_x, scale_y1, scale_y2.....) | The numbers that you want to be multiplied to each data point before it is plotted on the graph. | Similar to the Mul function for the single graph, multiplies the given scale value to each subgraph. The function does not apply for time_stamp. |
| graphObj.translateData(translate_x, translate_y1, translate_y2 ...) | The numbers that you want added to each data point before it is plotted on the graph. | Similar to Add function for the single graph, add the given number to each subgraph. The function does not apply for time_stamp |
Examples
var lineGraph = new boltGraph();lineGraph.setChartType("lineGraph");lineGraph.setAxisName('X-Axis Name','Y-axis Name');lineGraph.plotChart('time_stamp','var1');var barGraph = new boltGraph();barGraph.setChartType("barGraph");barGraph.setAxisName('X-Axis Name','Y-axis Name');barGraph.plotChart('time_stamp','var6');var Graph1 = new boltGraph();Graph1.setChartType("scatterGraph");Graph1.setAxisName('X-Axis Name','Y-axis Name');Graph1.plotChart('time_stamp','var1','var6');var Graph2 = new boltGraph();Graph2.setChartType("steppedGraph");Graph2.setAxisName('X-Axis Name','Y-axis Name');Graph2.plotChart('time_stamp','var2');var Graph1 = new boltGraph();Graph1.setChartType("tableGraph");Graph1.setAxisName('X-Axis Name','Y-axis Name');Graph1.plotChart('time_stamp','var1','var2','var3','var4','var5','var6');var Graph2 = new boltGraph();Graph2.setChartType("barGraph");Graph2.setAxisName('X-Axis Name','Y-axis Name');Graph2.plotChart('time_stamp','var3');var Graph3 = new boltGraph();Graph3.setChartType("lineGraph");Graph3.setAxisName('X-Axis Name','Y-axis Name');Graph3.plotChart('var5','var4','var3');Output
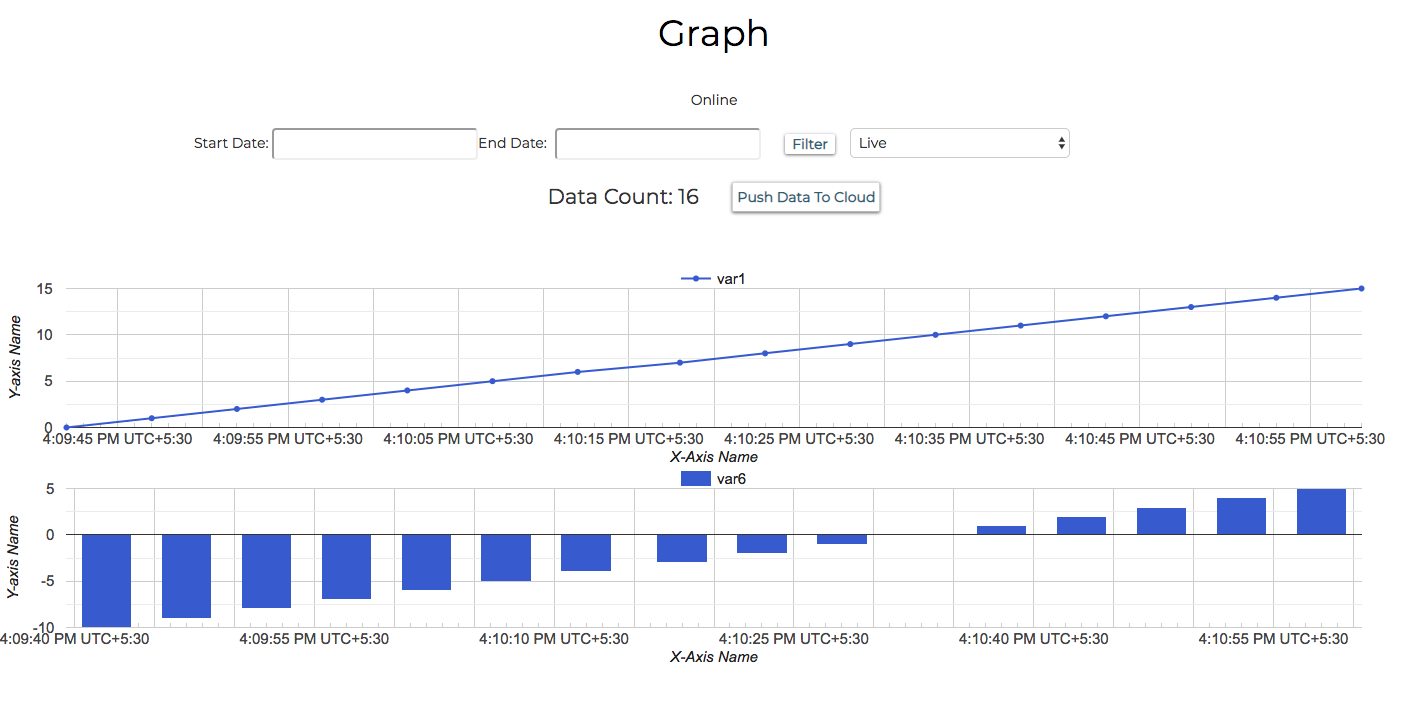
Output for code in example1
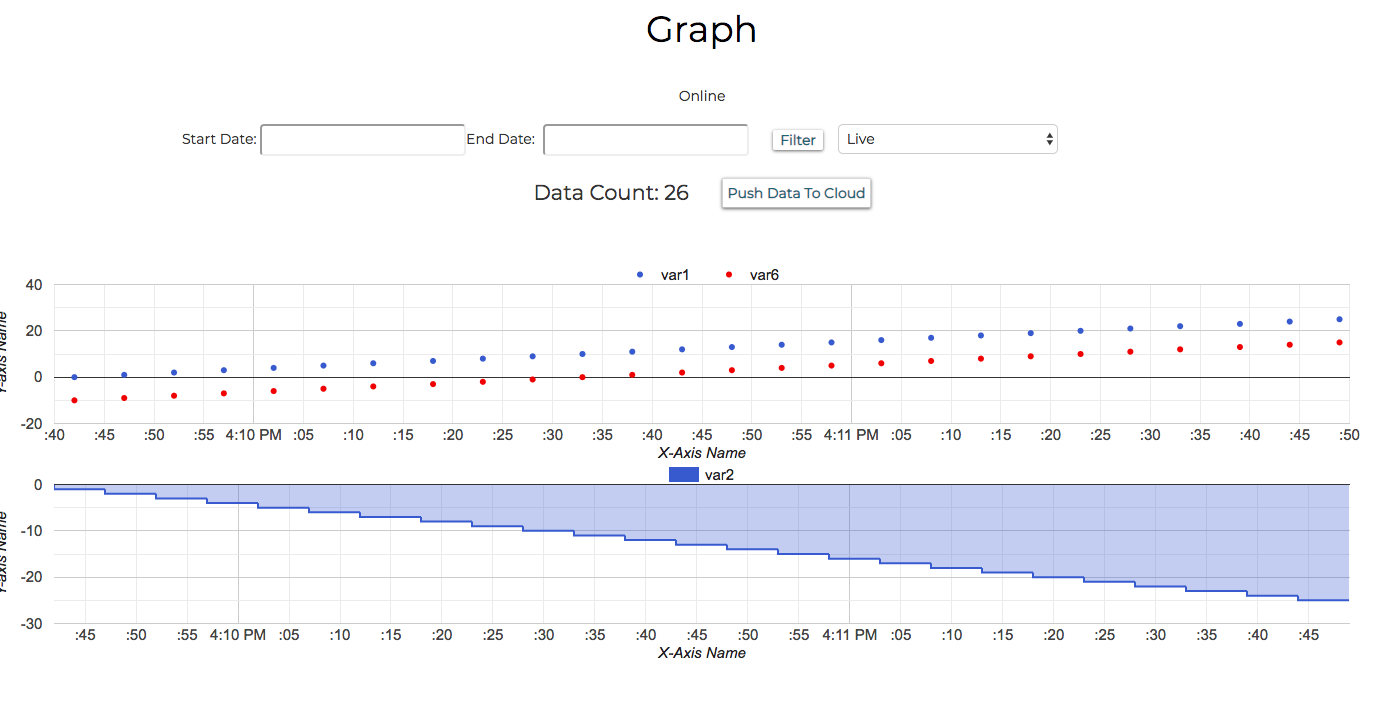
Output for code in example2
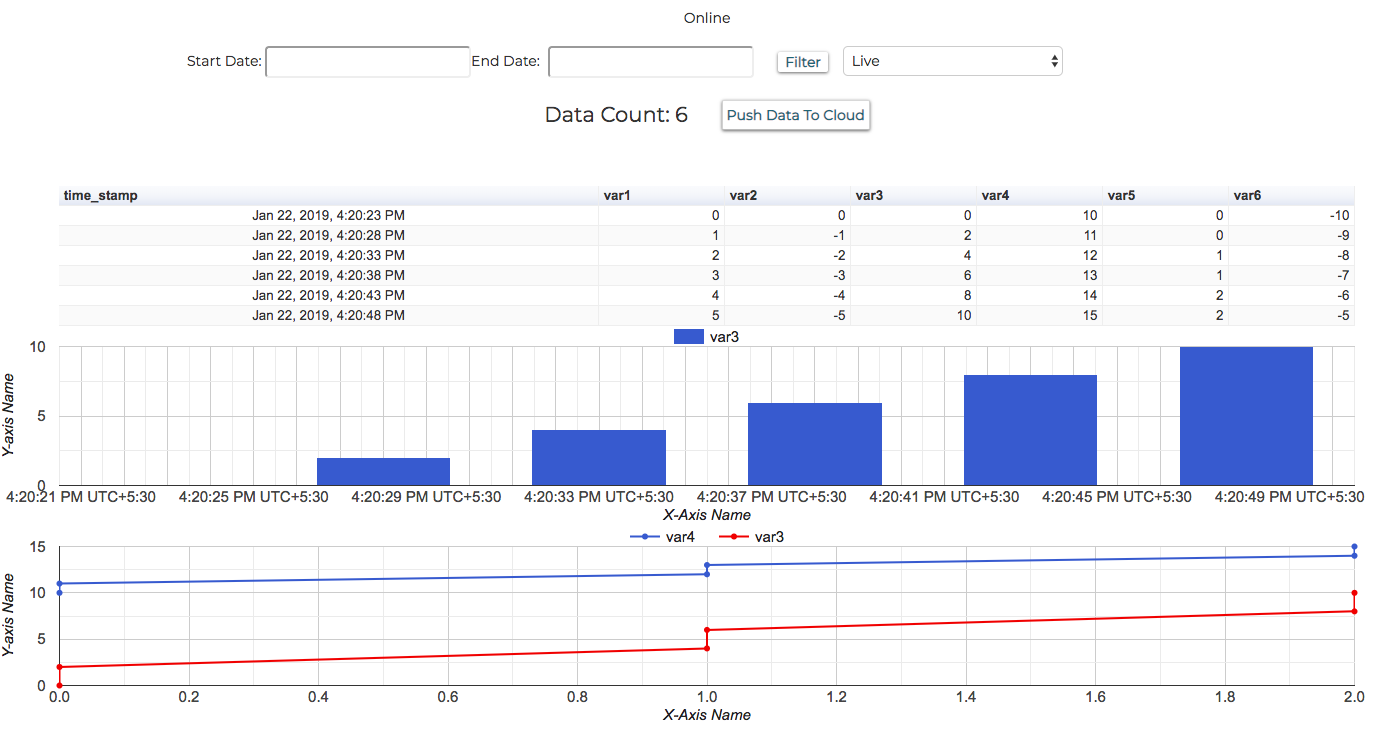
Output for code in example3
