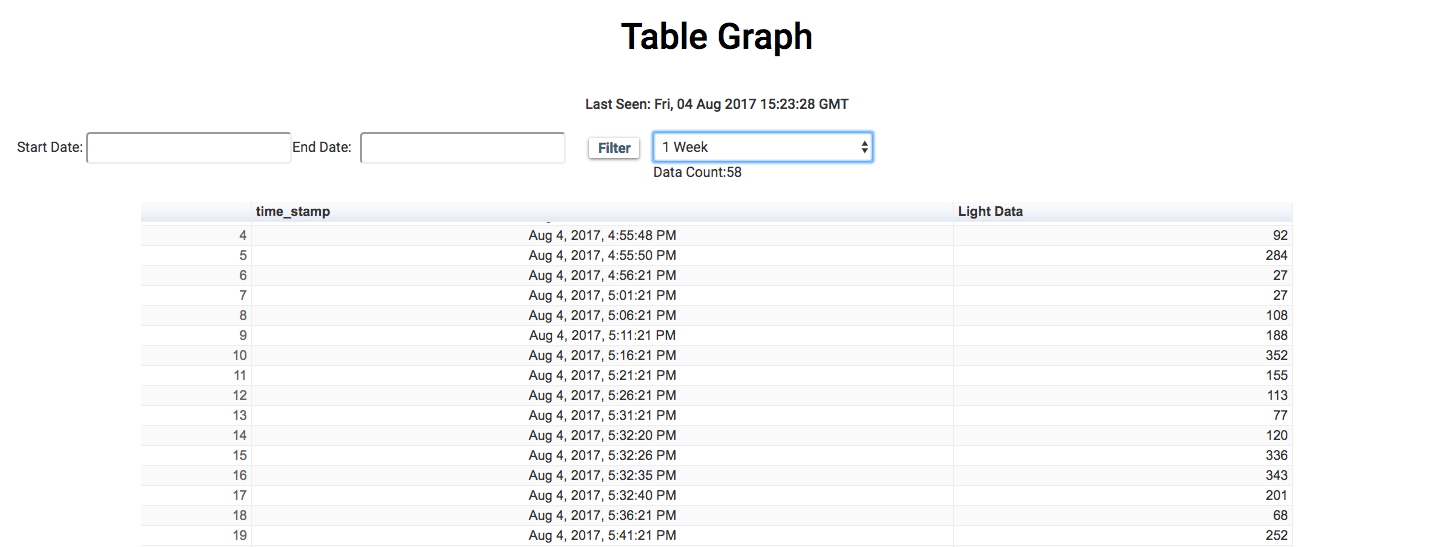
Table Chart
For a simple tabular representation, you can choose table chart.
Note: Choose the file extension as js.
Sample Code
setChartLibrary('google-chart');
setChartTitle('Your Graph Title');
setChartType('tableGraph');
setAxisName('X-Axis Name','Y-axis Name');
plotChart('time_stamp','your_variable_name');
Output

| Syntax | Parameter(s) | Description |
|---|---|---|
| setChartLibrary('google-chart'); | Library Name | Set the chart library to be used. Bolt Cloud uses 'google-chart' to visualize the data. |
| setChartTitle('Your Graph Title'); | Graph Name | Set the title of the graph according to your choice. |
| setChartType('tableGraph'); | Graph type | Set the type of chart to be plotted. Bolt Cloud offers 8 different types of charts to be plotted i.e Line Graph, Bar Graph, Scatter Graph, Area Graph, Table Graph, Stepped Graph, Histogram Graph and Gauge. |
| setAxisName('X-Axis Name','Y-axis Name'); | Axis Name | Set the display name for each of the graph axis. |
| plotChart('time_stamp','your_variable_name'); | Variable Names | Display the graph on the screen for the given variables.First parameter is always 'time_stamp' and second parameter is the variable name that you have given during hardware configuration of the product. |
| setLogo('logo_source', height, width); | Logo path & Dimensions | Set the logo of your choice to be displayed at the top left corner of the website. The first parameter is logo source and the second and third parameter is the height and width of the image in pixels. Every parameter is optional. Bolt's logo and height of 45 px are set by default. |
| setNumberFormatter('format type'); | Format type | Describes how numeric columns should be formatted. setNumberFormatter() function supports the following options as parameter - 'decimal', 'scientific', 'percentage', 'currencyInDollar', 'currencyInRupees'. This function should be called before the plotChart() function. |
| setDateFormatter('date format'); | Date Format | Formats the x-axis date value in a variety of ways. setDateFormatter() function supports the following options as parameter- 'mm/dd/yyyy', 'dd/mm/yyyy'. This function should be called before the plotChart() function. |
Updated almost 3 years ago
